Mirror design
The following code was used to find a rough estimate of what our vision would look like even though the result would change slightly with the thickness of the chroming process. To adjust for calculation errors, we used a linear regression model for greater accuracy over theoretical results.
'''
parabola=(0.045+(0.45x^2))^(1/2)
derivada=(1/2)(0.9x)(0.045+0.45x^2)^(-1/2)
'''
import matplotlib.pyplot as plt
AlturaCamara_Curva=5#cm
Altura_suelo=15.4
import math
ran =[]
x=0
print('--------------------------valores x:')
for i in range(25+1):#lista de 0 a 2.5(media parabola)
ran.append(x)
x=x+0.1
for i in ran:
print(i)
print('--------------------------angulos de tangentes:')
anguTans=[]
for x in ran:
tangente=(1/2)*(0.9*x)*(0.045+0.45*x**2)**(-1/2)#encontrar tangente con derivada
angulo = math.degrees(math.atan(tangente))#angulo de tangente
anguTans.append(angulo)
print(angulo)
print('--------------------------angulos de camara:')
#encontrar angulo de camara a parabola
ai=[]
for x in ran:
y=((0.1+x**2)*0.45)**(1/2)+AlturaCamara_Curva#AlturaCamara curva es la distaancia cm al punto mas cercano de la parabloa
if x==0:
ai.append(0)
print(90)
else:
angulo = math.degrees(math.atan((y/x)))
ai.append(angulo)
print(angulo)
print('--------------------------angulos triangulols222:')
dists=[]
orden=0
#encontrardistancia
for x in ran:
if x==0:
dists.append(0)
print(0)
else:
Y=2*(180-90-(ai[orden]-anguTans[orden]))
X=(180-Y)/2
anguTriangulo2=X-anguTans[orden]
print(anguTriangulo2)
distTotal=x+(Altura_suelo/(math.tan(math.radians(anguTriangulo2))))#ALtura suelo cm de altura respecto al suelo
dists.append(distTotal)
orden=orden+1
print('--------------------------distancias totales:')
for i in dists:
print(i)
plt.figure(figsize=(8, 5))
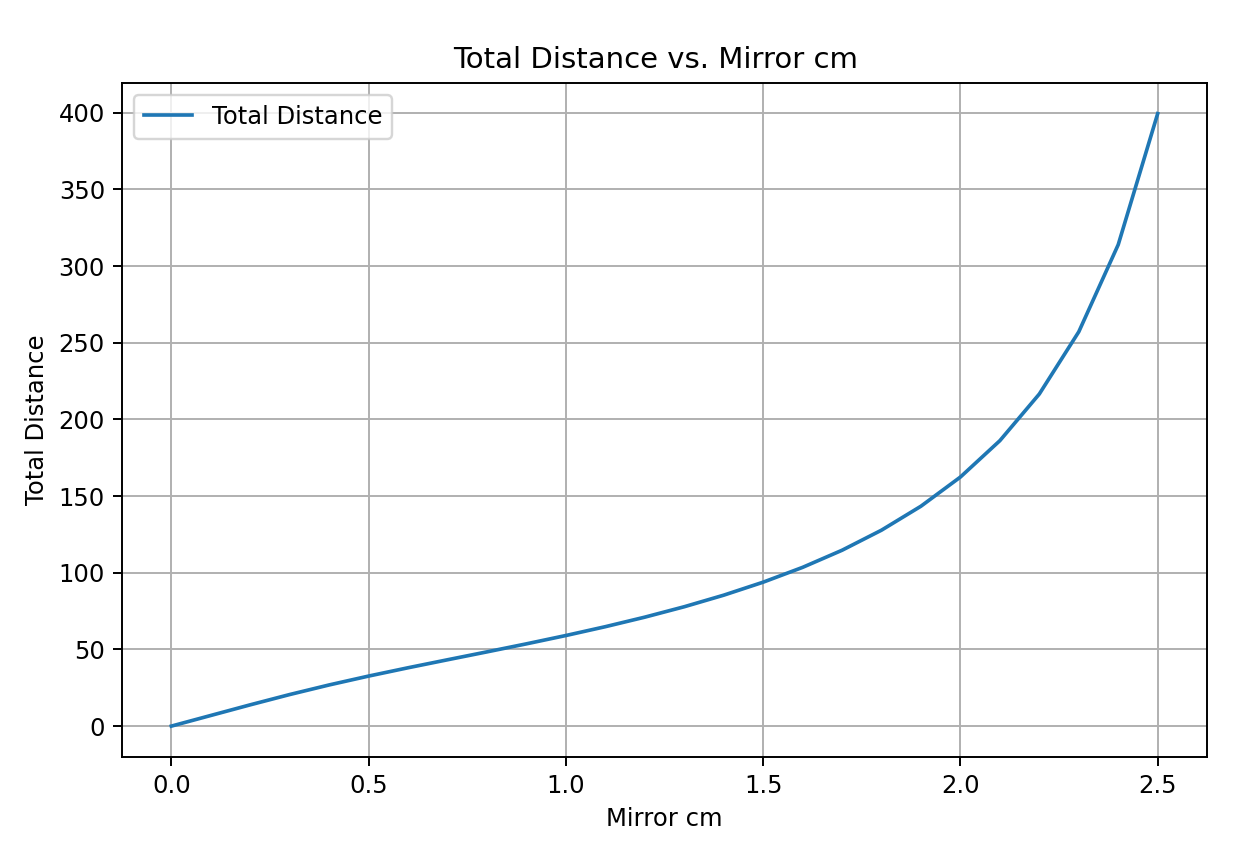
plt.plot(ran, dists, label="Total Distance")
plt.xlabel("Mirror cm")
plt.ylabel("Total Distance")
plt.title("Total Distance vs. Mirror cm ")
plt.grid(True)
plt.legend()
plt.show()
This is the graph showed by the code comparing meters of visibility and "x" axis distance on mirror hyperbola.
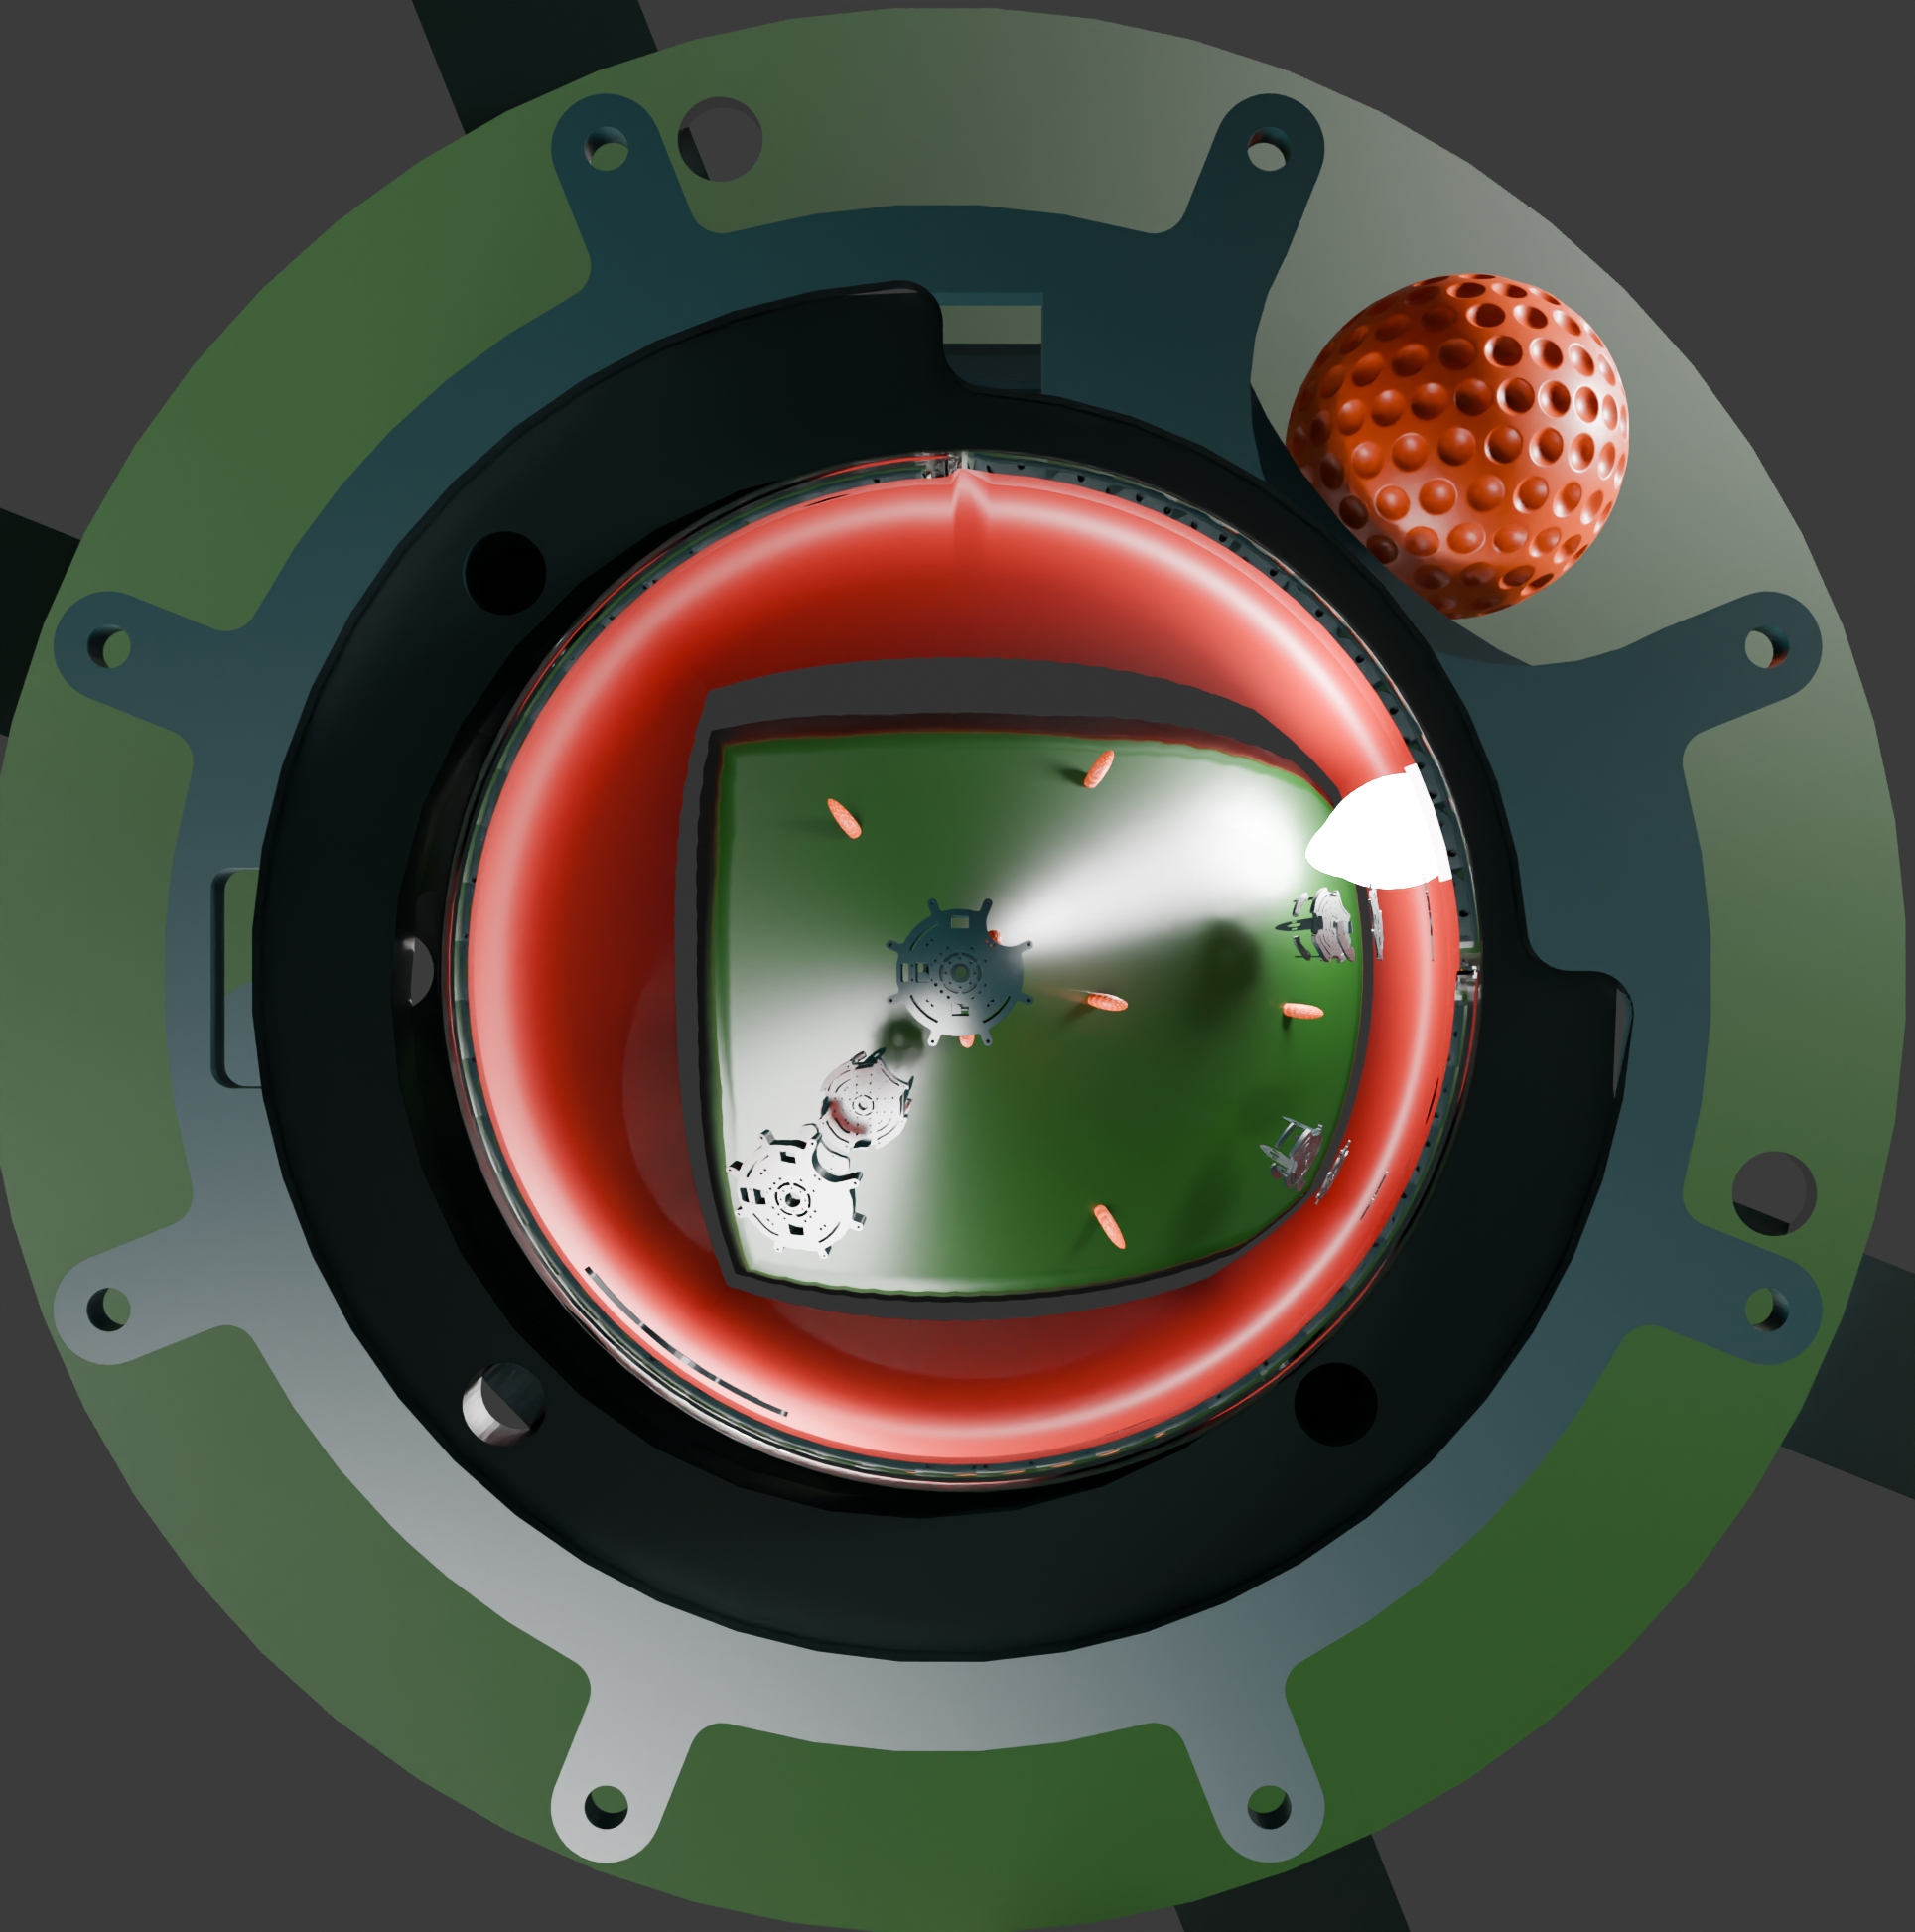
Design simulation in blender